Imagine: You want to fix margin of that div tag. You go to WordPress built-in theme editor to keep [insert #]px margin, since you don’t know whether this will fit; you test. You’re set to test out multiple margins. Each time you make an edit you save the file, open up your site only to find out it should be a 25px more. Once you push it by 25 pixels, you realize you didn’t mean that either. It’s a cycle, you make edit, save and refresh the page to see the result only to be disappointed.
If you’ve been there, you know it’s a pain in the neck. You don’t want to go through it, neither do I. But did you know you can escape it? That’s where Chrome Developer Tools (known as DevTools too) come in.
In this article we’re going to learn about Google Chrome Developer Tools, it’s use, how useful can it be in certain cases and have a sneak peak into what Chrome has for web developers and designers. And if you’re anything like me, you will love it!

Introduction
Google Developer Tools or DevTools is a pack of tools especially designed for web developers and web designers alike. It makes tweaking, customizing, testing and fixing HTML or CSS issues very easier. It gives internal view at the way web browsers, specifically, Chrome works. The thing to remember about DevTools is that whatever you do with Chrome Developer Tools is only visible on your browser. That means you’re not doing anything risky by playing around with code you’re not so certain of.
So do whatever you want; test different styles, fix issues or simply play. And if you feel satisfied with something, you can always deploy it to your live website.
Looking at it, it allows you to (to specify a few):
- See the basic structure behind a web page
- See and change CSS properties (+ values) targeted to a page element
- Customize layout, fix alignment issues
- Add custom JavaScript snippets
- Enable/disable a particular CSS property
- Insert CSS properties manually
With Chrome Developer Tools, you never need taste old cycle again; you don’t open a file buried under X directories, look for that element, save and at last refresh the web page to see changes. Because the way these tools work is super-innovative, you can edit a file without having to locate it with the use of Inspect element feature, make and watch changes live, thus testing made easy.
How to use it?
Chrome Developer Tools is easy to use and navigate, it has been organized into task-oriented groups. One can easily distinguish between HTML and CSS as they are organized column-wise. No need to switch between CSS file and body section for making respective changes, anymore.
There are two ways to access DevTools, either:
– Go to Chrome menu (located at top-right) » Tools » Developer Tools, a new window will open
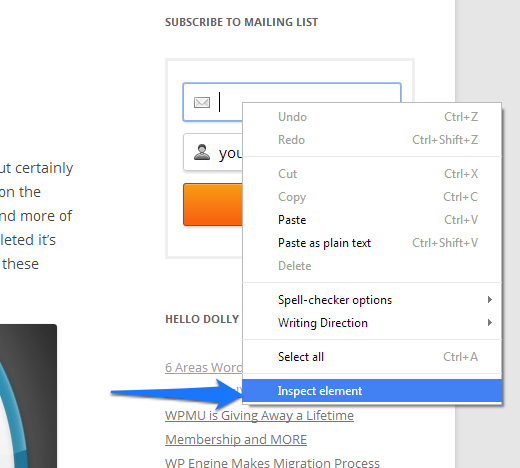
– Or right-click any page element and select Inspect element, it will open window focused on that element
Remember: Make sure you follow either of methods with a web page or web app opened.
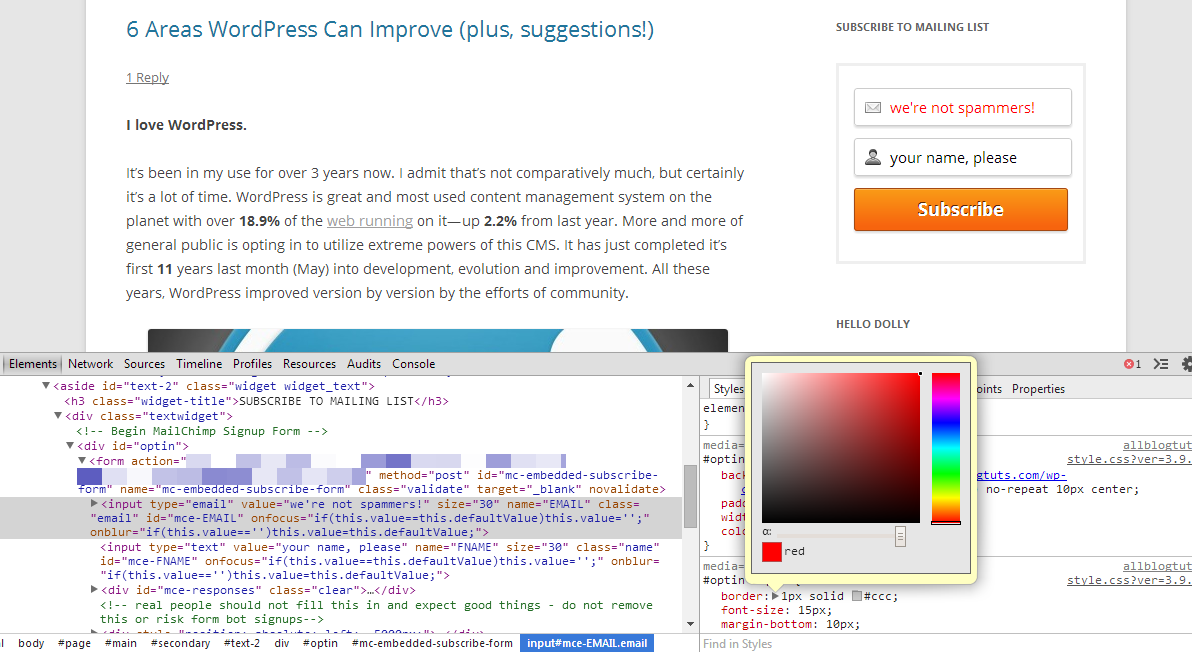
Now that you have DevTools window opened, you’re ready to explore it. You should be in the Elements tab by default and see two columns; HTML on the left, CSS on the right. There are eight tabs overall separated by respective tasks. Elements tab deals with HTML and CSS. On the left CSS properties, their values and selectors are visible. Hover over any HTML element, it will highlight that aspect of page allowing you to quickly locate a given aspect.
Since tutorials make understanding something complicated easier, we’re going to do a tutorial and customize an optin form. We’re going to try to improve its appearance. For the sake of understand Chrome Developer Tools
Side note: Whatever we do in this tutorial does not mean you too should. This tutorial or introduction article involves just a handful of things you can do with Chrome Developer Tools. And hey it is just to demonstrate the DevTools’ use. Nothing more or less.
Customizing an optin form
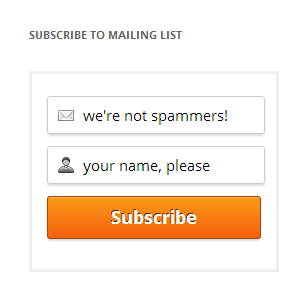
For this tutorial, this is the optin form I had set up.
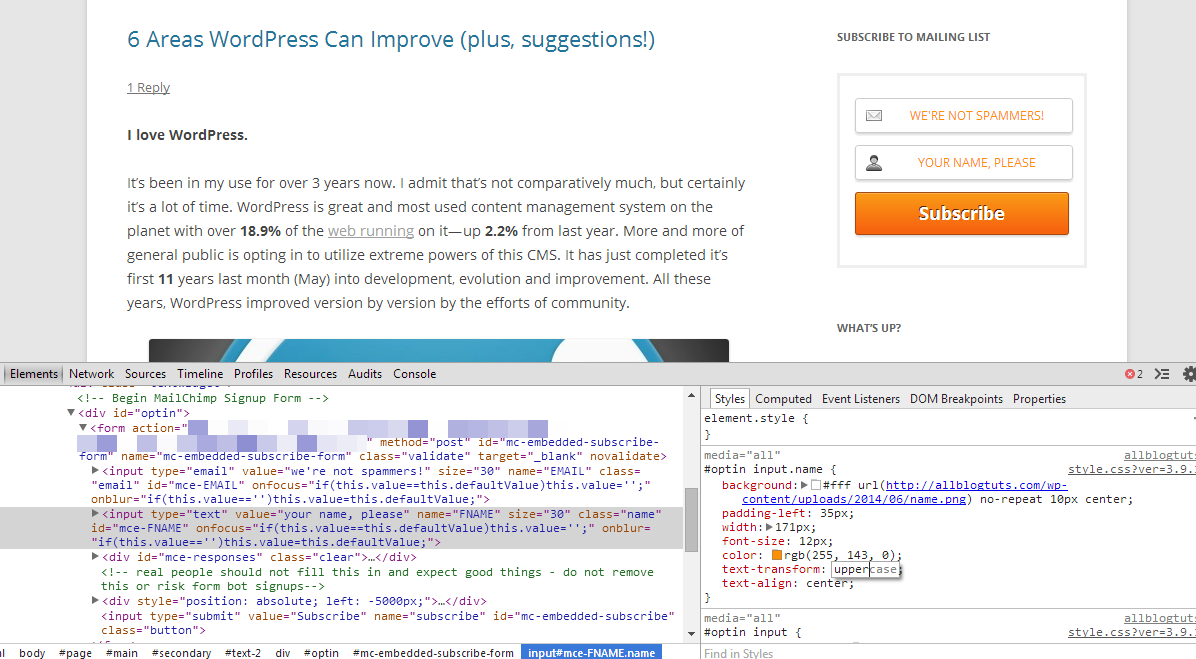
Right-click first field and select Inspect element.
You can see HTML on left, CSS on right. Move to styling, add a new property called color and set its value to red. Since it’s a color, you can use colorpicker to select a value.
Add these properties: text-align and text-transform with value as center and uppercase respectively. Former will center-align the text and latter will set letter case as UPPERCASE. You might prefer little smaller font. You can accomplish that by adding font-size property. Copy changes and apply them to name field as well.
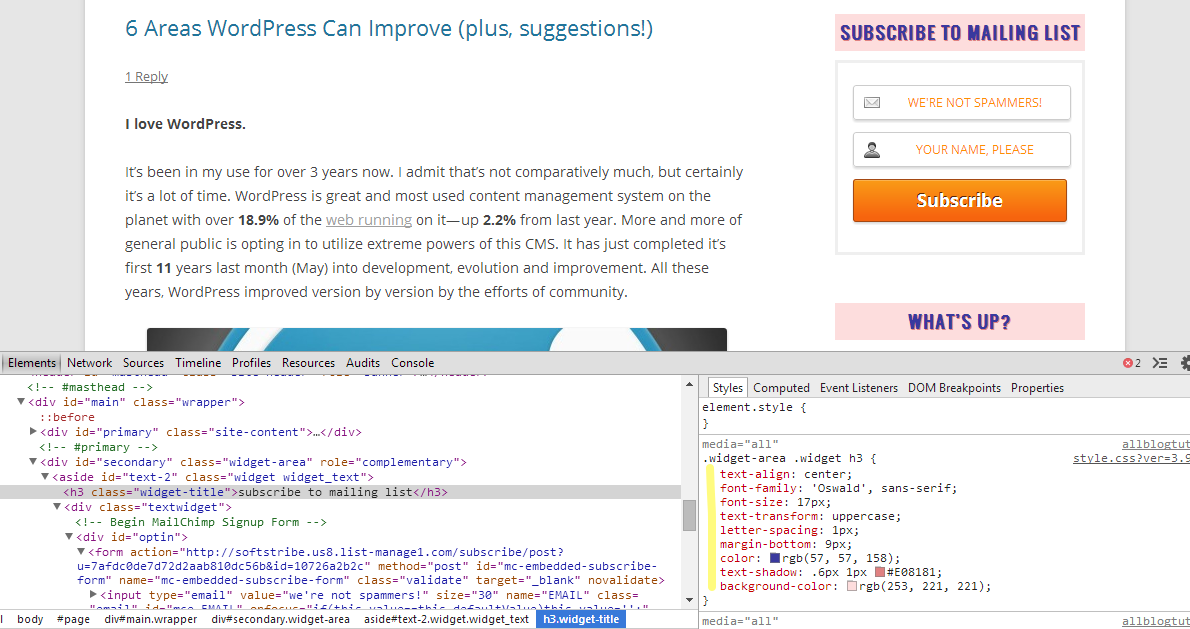
It’s time we customized our title i.e. SUBSCRIBE TO MAILING LIST. You see it’s tiny, dull and uses a simple font. Right-click it, select Inspect element. Let’s add following properties: font-family, font-size, text-align, background color, letter-spacing, text-transform, text-shadow and color. It’s better you don’t confine yourself to these, go ahead and add whatever please you.
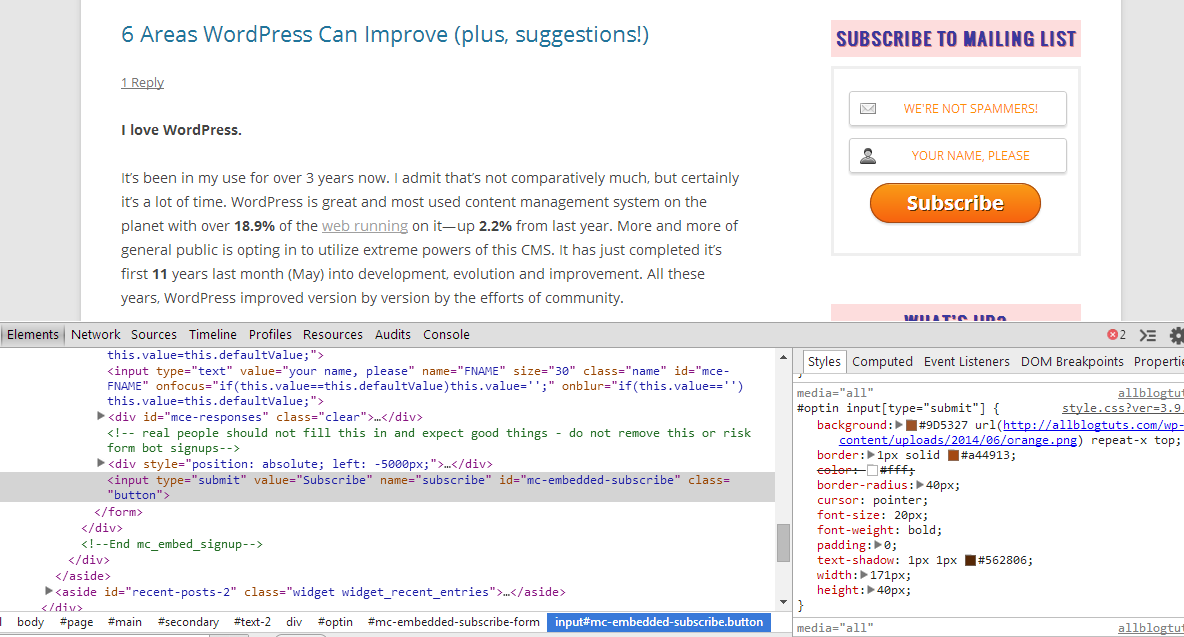
Done with title and fields? It’s time we customized the most important thing of an optin form; call-to-action button. Right-click it, select Inspect element. Look for selector targeting type=”submit”. Add following properties: set border-radius to 40px and try other properties. Here’s what mine looks like now.
Wait.. You might like Google Chrome Canary
Google Chrome Canary is same Chrome application except it’s been designed for web developers. Since there’s no sharing of files between regular Chrome and Canary channel, it doesn’t alter, modify or affect regular Chrome channel and works side-by-side. New Chrome features come almost on a daily basis in Canary. So be forewarned it is prone to breakage.
If you like Chrome Developer Tools, you will love Chrome Canary.
Conclusion
We’re done. Remember anything you do in Chrome Developer Tools is only visible in your browser. Refreshing the page will lose the changes. Chrome Developer Tools is a good place to do testing, fixing of issues and playing with code. You can use Chrome Developer Tools to see structure, properties being applied to an aspect or play with code of any web page or web app.