Everything Network Panel Chrome Developer Tools
We have been progressing at a quite good speed by learning about Elements panel, knowing it’s basic functions, etc. Remember in our introductory post, after Elements panel we had learned about Network panel? Now this is about time we explore & delve into Network panel. So that is what we’re aiming for in this article is-to understand working of Network panel along with it’s various uses, benefits & how else can you play with it.
Short Intro to Network panel
Let’s revise the definition of the Network panel: In Network panel records of all network operations taking place while a Web application or Web page runs are listed. Information such as detailed timing data, HTTP request and response headers, cookies, WebSocket and much more. Network panel uses Resource Timing API, a JavaScript API which provides detailed network timing data for each loaded resource.
How it works?
The Network panels records all the corresponding operations happening over network automatically if DevTools is open. If you open DevTools and move over Network panel, you might find it empty. That is because DevTools was not open while the network operations were occurring or no network operations have happened so far.
To make it work just reload current page while keeping focus at Network panel (DevTools) and as operations take place, they will be recorded accordingly in a tabular form. These records are displayed in a table of ~20 columns. Each column is assigned to contain a particular piece of information about the operation.
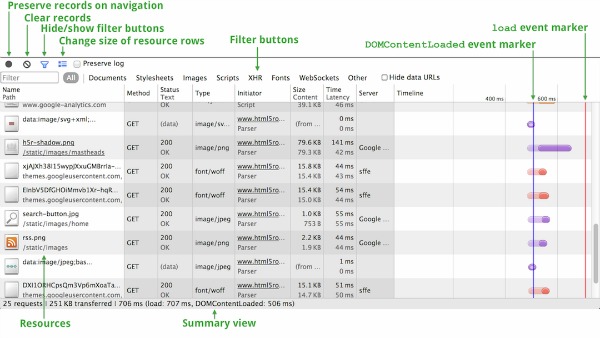
Here’s is an overview of Network panel:
Using Network panel
For sake of understanding we will use Softstribe.com itself. While you’re on this website right-click anywhere on the page and select Inspect element. Move towards Network panel and press F5 key. You will notice a timeline network operations taking place will begin to populate on the table. In each row a separate resource, network operation or request is recorded. Each row provides information about the corresponding network operation.
Here are some basic columns with their descriptions:
- Name and Path: In this column is the name and the URL of the respective resource.
- Method: Method tells the HTTP method used to request the server (e.g. GET or POST)
- Status and text: The HTTP response code and text message exists in this column.
- Domain: The domain of resource.
- Initiator: The process or action that initiated the request. Possible values are Parser (Chrome’s HTML parser initiated the request), Redirect (HTTP redirect initiated the request), Script (some script initiated the request) and Other (some other process or action is involved like user clicking other link).
- Cookies: The # of cookies transferred in the response.
- Time and Latency: From starting of request to the receipt of final byte the total duration it took is called Time. Whereas the total time taken to load first byte in the response is called Latency.
- Timeline: This column gives a graphical view with the help of bars (Waterfall view), which tell how much time it took to load a resource from the start and receiving of final byte. Clicking the header of this column gives you options to filter this column, making itself unique from the rest.
So what can you do with Network panel?
Well clicking the name of a resource via Name and Path column takes you to a different view, where you can know the HTTP headers sent to server, the response it got as a preview, Response, Cookies it saved and Timing (timings of Sending, Waiting & Receiving). You might think, well, what is the use of these technical details? Heh? Don’t you believe these pieces of information are of no use. These can be of great use from perspective of a Web performance junkie (that I keenly am).
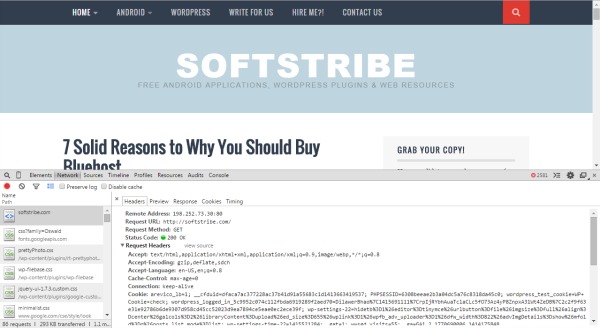
Only with the use of Name and Path column you can:
- know what HTTP headers are sent to server
- what cookies are being stored and how much
- how browser renders a resource
- know Sending, Waiting & Receiving timings
Network panel provides answers to question such as and including:
- When much time a request took to load?
- When response started being received?
- How much time it took for a request to receive it’s first byte (also known as Latency)?
- When DOMContentLoaded and Load events were fired?
- How much time Blocking took?
- How much time DNS lookup consumed?
- How much time it took to Wait for response?
- How much time it took receiving?
These are questions make Web performance optimization discipline what it is – interesting. These tiny bits of details can be of big use and prove to be vital to note.
Preserving a network log data
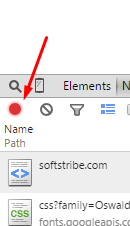
By default record log will vanish if you navigate to another page or reload the page. Just in case you want to preserve network record log, there’s a button called Record Network Log. There are two modes of this button; black and red. Black represents ‘preserving mode off’, whereas red represents ‘preserving mode on’.
Can I save/copy network data?
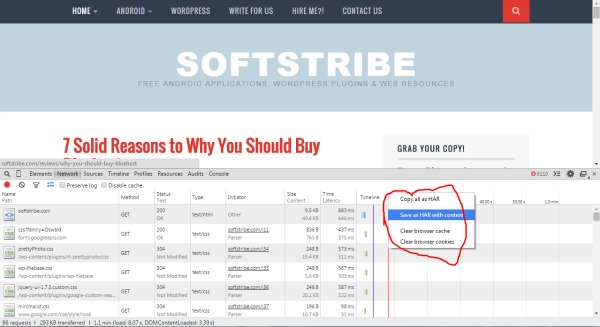
In short yes. HOW: There are two ways to copy the network table data. Right-click the network table and a list of options will appear. From options two are for copying/saving data:
- Copy All as HAR: Clicking this will copy the data in the system clipboard as HAR format.
- Save as HAR with content: Clicking this option will save the data in a HAR file format.
Working of Timeline column
The unique of all given columns from Network panel is Timeline column. It’s unique because of the unusual behavior that it shows. Clicking the header will give you more options. These options are sort of filters to filter data provided in Timeline column and help with understanding different aspects of downloading and rendering a Web page.
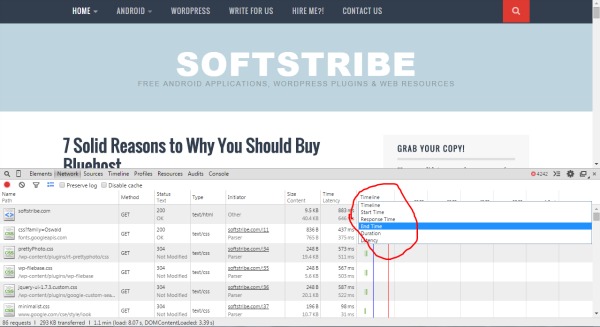
These options are described:
- Timeline: This is the default sorting and is same as Start time. It sorts the records according to the start time of requests.
- Start time: It sorts records as per the start time of requests. Meaning the request that started first by time comes to top/bottom.
- Response Time: Sorts records in accordance with the response time of requests.
- End Time: Sorts records accordingly the end time.
- Duration: Sorts requests accordingly the time it took each request from start time to end time.
- Latency: Sorts by the start of request and receipt of response. (also known as “time to first byte”)
Conclusion
We’re done. Today we learned and explored a lot about Network panel of Chrome Developer Tools. The kind of information that this panel provides is really of great use for a Web performance optimizer. Not only that. Anyone concerned about making their websites load faster can make use of this tab to access vital information. To recap, we learned:
- How Network panel works
- How to utilize Network panel
- How the panel is organized
- To read and make sense this panel
- Lots more.