How to Insert Google-Like Pie Charts to Posts in WordPress
Iced Visualization Chart WordPress plugin lets you input Google-Like Pie Charts to posts in your WordPress blogs. With this plugin you can easily add Pie Charts by clicking a single button inside of post/page editor and simply input the data about Pie Chart. An example of the Google-Like Pie chart is right over here:

How Iced Visualization Chart Works?
All you have to do is simply install Iced Visualization Chart and activate this plugin. To add a Pie Chart in your blog follow these steps:
1. Go to Posts > Add New
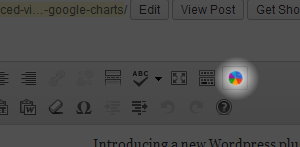
2. Now, clicking that colorful circular button from the post editor, you will be able to input the data in the Pie Chart. As I did:
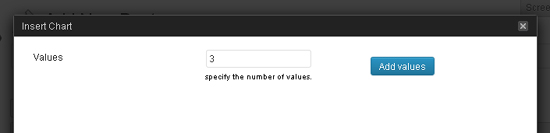
3. At first add the values about how many blocks do you want to add in the Pie Chart:
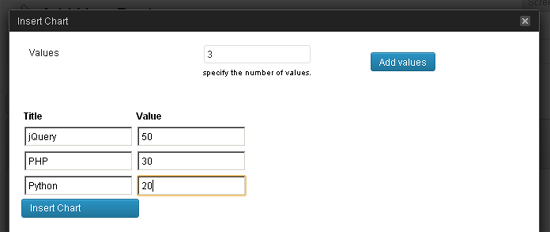
4. Then simply add the Title about each block and simply assign the Value to each block, like:
5. Now, if you publish the post and view it. You will see an awesome Google-like Pie Chart.
Note: Previewing the post may not work because the preview page is somewhat weird.
Thanks a lot. I was searching for similar once, found this great plugin. You can also inser Column Chart which i wanted.