
5 Best WordPress Plugins to Display Pie and Bar Charts in Posts
I know that Pie and Bar Charts are the one which can show a visual look about something to your visitors. These charts let’s you divide the worth data into sectors and display the information such as poll data, Sports scores, comparison of something, etc. For example, if you are in web design then let me create a pie chart about, which of the following languages is hard to understand (For me 😉 but I know I can do it).
1. jQuery
2. PHP
3. Python
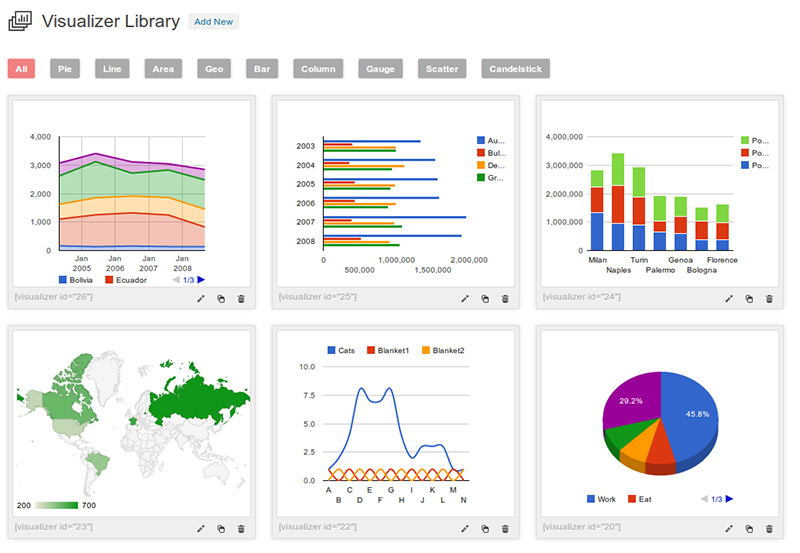
1. Visualizer
Visualizer is a simple WordPress plugin which is easy to use and quite powerful tool for creating PieCharts, Bar Charts much like Google. Because this plugin uses Google Visualization API to render charts, which support cross-browser compatibility and cross-platform portability to iOS and new Android releases.
Download Visualizer for WordPress | More about Visualizer
2. Iced Visualization Chart
Iced Visualization Chart WordPress plugin lets you input Google-Like Pie Charts to posts in your WordPress blogs. With this plugin you can easily add Pie Charts by clicking a single button inside of post/page editor and simply input the data about Pie Chart.
3. Tally Graph
WordPress already lets you attach custom data to posts, but what Tally Graph WP plugin does is that you can plot that data over time using the Google Chart API. Any numeric data will work, whether it is related to athletic training, profits, environmental footprint, weight loss, or any topic you care about.
4. ChartBoot for WordPress
ChartBoot for WordPress plugin allows you to create, edit and embed Google-like pie charts in WordPress Posts/Pages.
5. WordPress Charts
Using WordPress Charts plugin, you can create amazing HTML5 charts so easily in WordPress. A flexible and lightweight WordPress plugin to add visualization charts. You can also customize chart types (pie, bar, line, radar, polar area and doughnut types) as well as a fallback to provide support for older IE.
6. Easy Chart Builder for WordPress
Easy Chart Builder for WordPress plugin enables you to insert pie and bar charts easily inside of your blog using shortcodes. Actually, the charts are intended to make the posting detailed measurements easy, such as poll data, comparisons, scores to something, etc. All you have to do is to specify the names of the devices that will be measured, the tests that had performed.


Pretty useful plugin. Is there any plugin that will change dynamically based on data. For example, pie chart of our WP categories – we’ll know which categories got the most articles etc.
Wow, it’s a good idea @Rudd. But I don’t think there is any plugin who does this. Okay let me know if you find any plugin like this I’ll share it over here.
Hey There
Thanks for including WordPress Charts in your round up, check out the updated version.
Kind Regards
Paul
Hey @Paul, your welcome.
Wow, what a collection! I was trying to figure out how to create charts on one of my blogs and a friend told me that there are wordpress plugins for that. I googled it and came to your site.
Thanks for this list.
Hi @Reuben, thanks for reading our articles. Keep visiting us for new stuff about WordPress.
Dear Muhammad,
Sweet blog!
I need informations, to build a very specific chart. If you have time to helping me, it will be great!
I’m building a website for my students with WP, a space where they can download exercices, and put their results daily.
I precisely need 3 curves (each curve corresponds to a cotegory: reflection, resolution, speed)
After 15 daily exercices, the student have to enter on his personnel profil, 5 ratings for each 3 categories (correponding to 3 curves):
Example:
Curve 1 > 5 boxes for 5 ratings => when submit is done, it generates 1 average rating => corresponds to a 1 new point on the curve (curve 1 encreased by 1 step)
Curve 2 > 5 new boxes to complete => after submit, the average generats a new point on the curve 2
Curve 3 >…etc
Thus, each student could see his average on points daily generated, and get a progression line.
Doing that is possible with these plugins?
Is it possible to guide me on such settings or make a tutoriel?
WP-Charts or Google Charts plugins seem be perfects for my project, but my informatic skills are very limited. I would like to continue this project and develop a site for next year for my students found something a little more dynamic in their education and more matches to their “connected” way of life.
Thank you,
Best Regards,
Bilal.